- By Function
- Solutions
We provide a range of data services to help our clients uncover the true story their data is telling them and facilitate data-driven decision making.
Our expertise spans 5 key technical areas, from data visualisation to data science. Explore our solutions based on your technical requirements or by your business function.
- By Technical Need
- By Technical Need
Explore our Solutions
We provide a range of data services to help our clients uncover the true story their data is telling them and facilitate data-driven decision making.
Our expertise spans 5 key technical areas, from data visualisation to data science. Explore our solutions based on your technical requirements or by your business function.
- Data Strategy
From data storage and management to processes and analysis, we’ll help you get the most out of your data. We’ll audit your commercial requirements, review your KPI frameworks and design a custom solution that helps you achieve your goals.- Data Platforms
With a variety of cloud data platforms (Azure, GCP & AWS) in the market, it can be tough to choose the right platform for you and your business. As experts in data, we can guide you on the right solution based on your business needs.- Data Visualisation
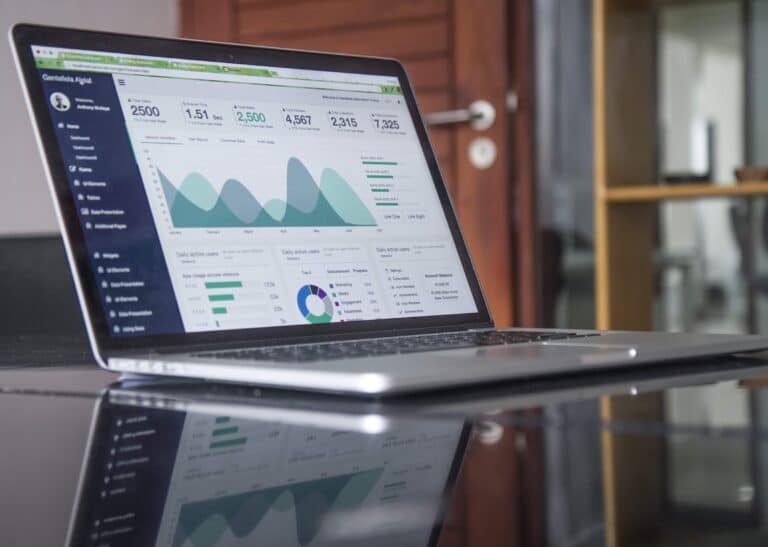
We are technology agnostic and experts in a wide range of tools that can help you better visualise your data, from Power BI and Looker to Qlik Sense and Tableau.- Data Science & AI
Our team of data scientists are experts in helping businesses gain actionable insights from their data. We can build you custom AI solutions using the latest machine learning techniques.- Data People
Looking for an agency that can act as an extension of your in-house team, or provide a fully managed service? We can step in and help fill your skills gap.- Ecommerce
Understanding the performance of your eCommerce site is essential for growth. We can provide those insights, and optimise performance, through a variety of techniques, such as CRO, A/B testing, tagging and tracking, and visualisation.- Marketing
We’ll help you to understand the true performance of your marketing campaigns and which channels are driving the best ROI, so you know where to best allocate your investments.- Operations
We are experts in helping organisations use their data to help optimise their business operations including logistics, channel management and financial reporting.- Finance
We are experts in helping
organisations use their data to help
optimise their finance processes
including automated financial reporting, and revenue forecasting. - About Us
We’re on a mission to build a world-class organisation that helps businesses transform the way they manage and utilise data. Find out more about us, our people and how we’re planning on achieving our mission.
About Us
We’re on a mission to build a world-class organisation that helps businesses transform the way they manage and utilise data. Find out more about us, our people and how we’re planning on achieving our mission.
- Resources
Explore our resources hub for the latest insights, guides, demos and case studies.
Resources
Explore our resources hub for the latest insights, guides, demos and case studies.
- Join Us
Explore our resources hub for the latest insights, guides, demos and case studies.
Join the Jarmany Team
Looking to launch a career in data and analytics at a company that values learning, development and social connections?
Check out our current vacancies today.
- Solutions
We provide a range of data services to help our clients uncover the true story their data is telling them and facilitate data-driven decision making.
Our expertise spans 5 key technical areas, from data visualisation to data science. Explore our solutions based on your technical requirements or by your business function.
- By Function
- By Function
- By Technical Need
- By Technical Need
Explore our Solutions
We provide a range of data services to help our clients uncover the true story their data is telling them and facilitate data-driven decision making.
Our expertise spans 5 key technical areas, from data visualisation to data science. Explore our solutions based on your technical requirements or by your business function.
- Data Strategy
From data storage and management to processes and analysis, we’ll help you get the most out of your data. We’ll audit your commercial requirements, review your KPI frameworks and design a custom solution that helps you achieve your goals.- Data Platforms
With a variety of cloud data platforms (Azure, GCP & AWS) in the market, it can be tough to choose the right platform for you and your business. As experts in data, we can guide you on the right solution based on your business needs.- Data Visualisation
We are technology agnostic and experts in a wide range of tools that can help you better visualise your data, from Power BI and Looker to Qlik Sense and Tableau.- Data Science & AI
Our team of data scientists are experts in helping businesses gain actionable insights from their data. We can build you custom AI solutions using the latest machine learning techniques.- Data People
Looking for an agency that can act as an extension of your in-house team, or provide a fully managed service? We can step in and help fill your skills gap.- Ecommerce
Understanding the performance of your eCommerce site is essential for growth. We can provide those insights, and optimise performance, through a variety of techniques, such as CRO, A/B testing, tagging and tracking, and visualisation.- Marketing
We’ll help you to understand the true performance of your marketing campaigns and which channels are driving the best ROI, so you know where to best allocate your investments.- Operations
We are experts in helping organisations use their data to help optimise their business operations including logistics, channel management and financial reporting.- Finance
We are experts in helping
organisations use their data to help
optimise their finance processes
including automated financial reporting, and revenue forecasting. - About Us
We’re on a mission to build a world-class organisation that helps businesses transform the way they manage and utilise data. Find out more about us, our people and how we’re planning on achieving our mission.
About Us
We’re on a mission to build a world-class organisation that helps businesses transform the way they manage and utilise data. Find out more about us, our people and how we’re planning on achieving our mission.
- Resources
Explore our resources hub for the latest insights, guides, demos and case studies.
Resources
Explore our resources hub for the latest insights, guides, demos and case studies.
- Join Us
Explore our resources hub for the latest insights, guides, demos and case studies.
Join the Jarmany Team
Looking to launch a career in data and analytics at a company that values learning, development and social connections?
Check out our current vacancies today.


